Flow Cytometry Software
Frank Battye - Flow Cytometry Consulting
Population Linking
New in Weasel version 2.0: Released 26th Sep 2003
This is a method for displaying multi-parameter data by an enhancement of the traditional display formats. Displays are linked by plotting, in a number of formats, a common, dynamically chosen sub-population. The results may be viewed live.
The linking region may be 1D (defined on a histogram or parallel coordinates display) or 2D (defined on a biplot, dot plot or contour display). The region-delimited subpopulation may be shown in a separate 1D, 2D or 3D display. As the region is moved, the linked display will be updated continuously.
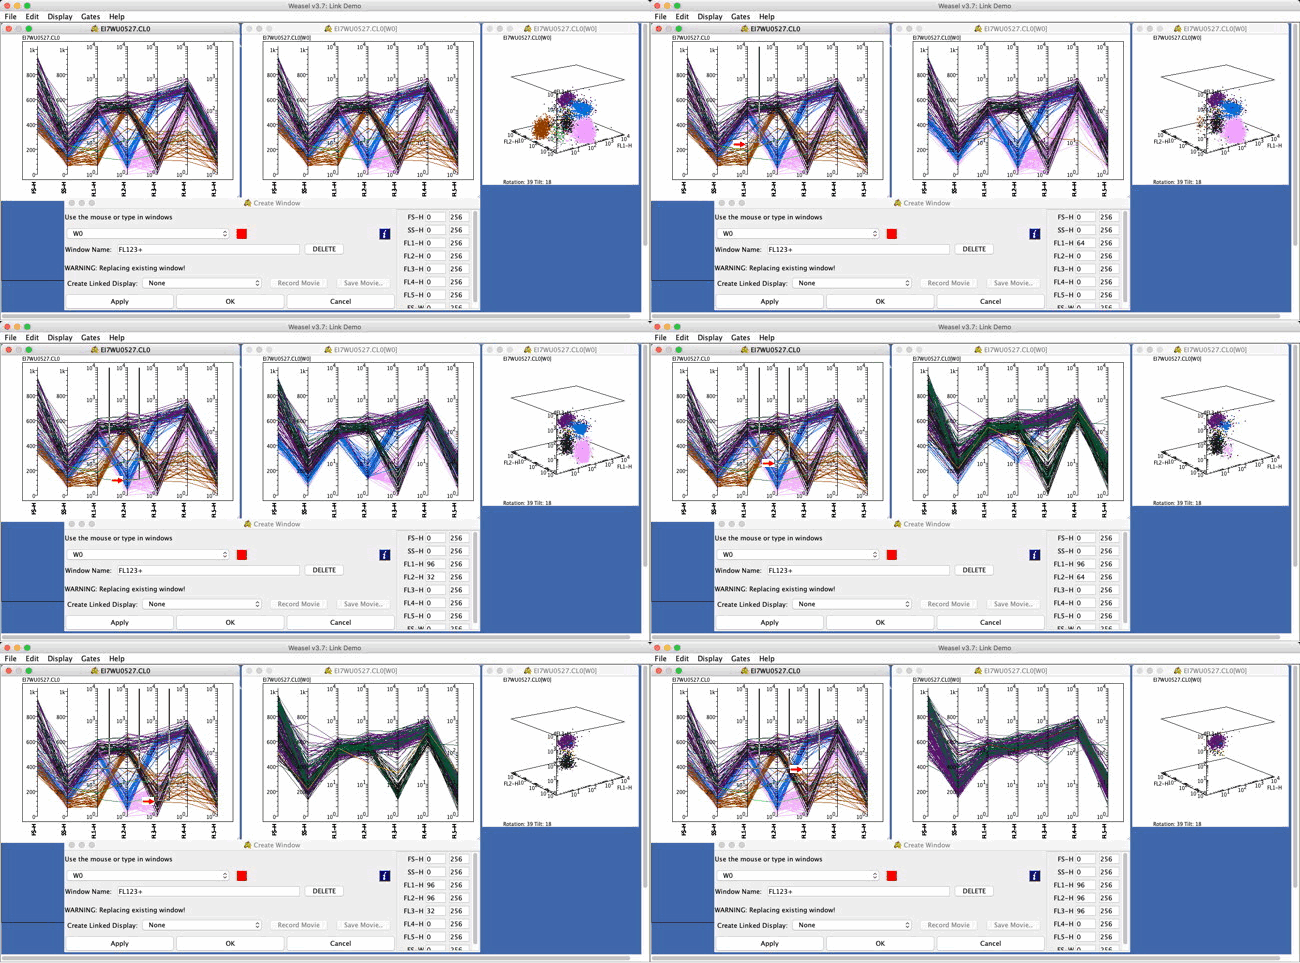
Parallel coordinates displays show, for each cell, a correlated view of any number of the measured parameters. The population linking technique is valuable for revealing populations for which only some characteristics are known. If a 1D region (window) first delimits the known characteristics, then the range of remaining characteristics is revealed. See the sequence below.

A
1D window delimits in turn a range of FL1, FL2 and FL3 in
a parallel coordinates display (see the red arrow marking
the moving lower limit). For this data those 3 parameters
are sufficient to select a single cluster defined by all
parameters. The 3D dotplot further illustrates the
progress.

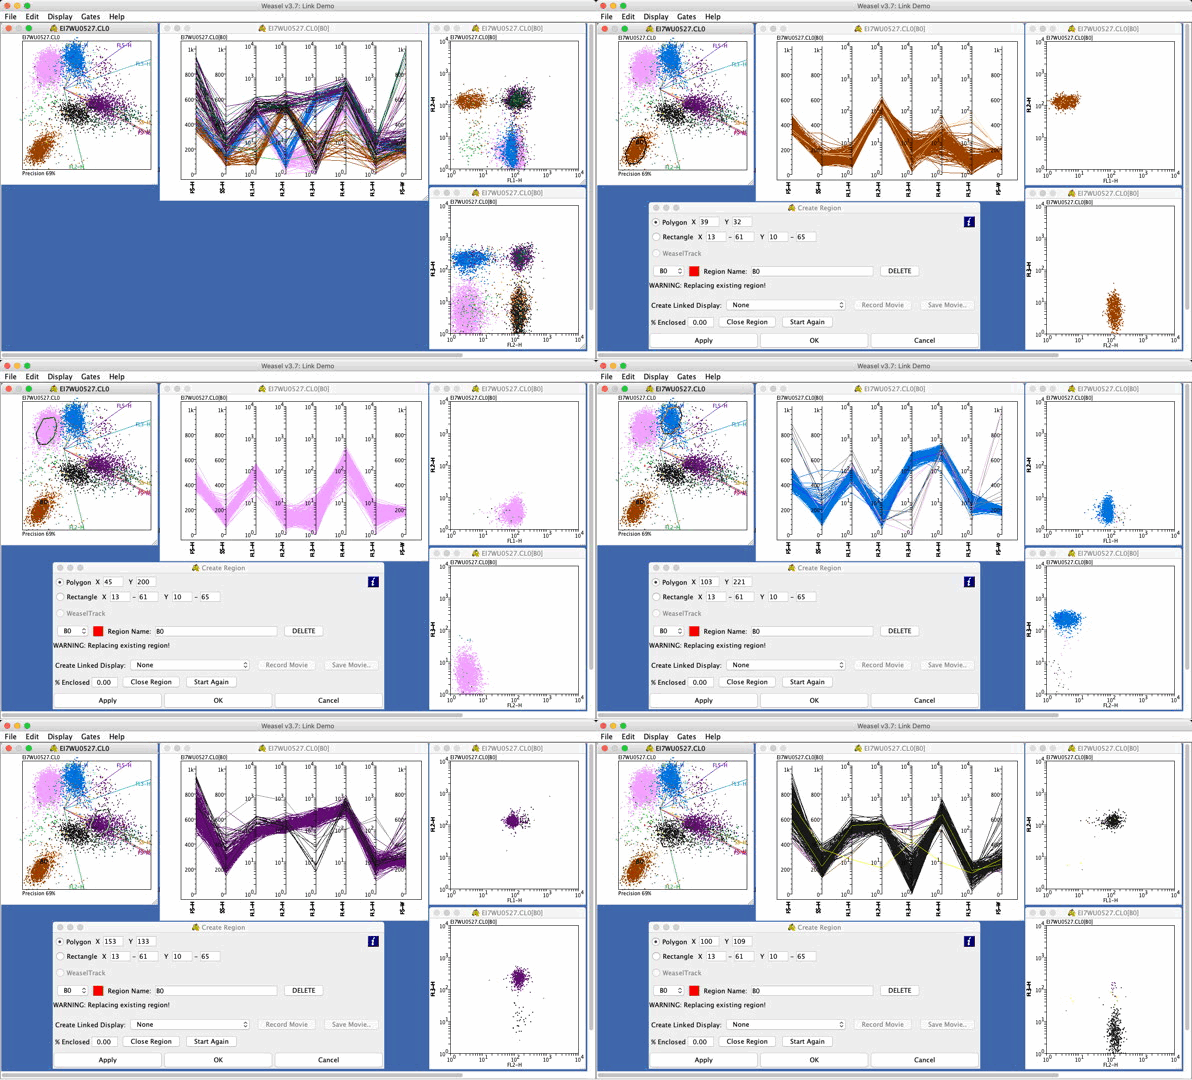
A 2D
biplot region selects in turn various clusters shown in the
biplot. The fluorescence characteristics of the selected
cluster are shown by the parallel coordinates display and the
dotplots.
While a
biplot may separate the cell clusters in a file, the
fluorescence characteristics of each cluster are often not
obvious. Linking to a parallel coordinates display or to
dotplots reveals the characteristics.
A typical
sequence is as follows:
-
Create the primary display.
-
Launch the region creation dialog.
-
Create the initial region.
-
Select a display type at "Create Linked Display" and set, when prompted, a data file, usually the same file as in the primary display or a file from the same data set, and a display format. Note that the log/split display settings should be the same for all linker and linkee files.
-
Move the region and observe changes in the linked display.
The region
may be linked to one or more 2D or 3D dot plots, 2D
or 3D biplots, contour plots, histograms or parallel
coordinates displays.
Return to Weasel Home..
Return to Frank Battye: Flow Cytometry Consulting..
